Tag: pollinators

  • What Have We Learned From 6 Years of Monitoring Wild Bees?

    What Have We Learned From 6 Years of Monitoring Wild Bees?

    There are around 4,000 bee species in the US and over 400 in Pennsylvania (Figure 1). With so many species it’s very difficult to know what’s going on with each species and any collection of species that co-occur at any given location. There’s growing concern that bees are declining because of a variety of stressors such as habitat loss, pesticides, invasive species, and climate change. While there is good evidence that some bumble bee species in the US are declining, the status and trends for most other species are largely unknown due to a lack of data. This is why there’s an ongoing effort to establish a US nationwide bee monitoring program. In our recently published paper we looked at changes in populations of many bee species using data from 6 years of intensive bee monitoring.


    A grid of 12 bee photos sitting on flowers. The bees vary in size, shape, and color.
    Figure 1. A variety of bees found in Pennsylvania, photos by Nash Turley CC BY-NC-SA 4.0

    We’ve been working to understand how populations of bees in-and-around several apple orchards in Southern Pennsylvania are changing over time. To do this we’ve been monitoring bees for the last 6 years using Blue Vane Traps (Figure 2), a type of trap that attracts and captures a wide variety of bees. With these we’ve collected data on what bees are active every single week between April and October for 6 years in a row. So far we’ve collected 144 species! This is 33% of the species found in the whole state. As is the case in all collections of species in nature, most species were rare, for half of the species we collected 5 or fewer individuals. However, we did have 40 species with enough observations to be able to look at population trends over time.


    A photo of a blue vane trap hanging from a pole with green vegetation in the background. The trap is about 1 foot tall with bright blue top with vanes and a funnel leading into a yellow tub at the bottom
    Figure 2. Blue Vane Trap, a type of insect trap that attracts and captures a wide variety of bees and other pollinating insects. Photo by Nash Turley CC BY-NC-SA 4.0.

    We found that 26 species were stable over time, that is, no detectable change in abundance between 2014-2019 (Figure 3). However, 13 species, or about ⅓ of the species we could measure, declined in abundance over time. Many of the declining species were bumble bees and sweat bees. By contrast, only 1 species increased in abundance over time. In addition to changes in species’ abundances, we also saw declines in the number of species observed. At the peak year we found an average of 46 species at each collection site which dropped to an average of 30 species per site at the end of our study.


    Three graphs with bee abundance on the y axis and years on the x axis with points and trend lines. These show the abundance of bees between 2014 and 2019. The first graph there is no trend, no change over time, which is the pattern for 26 species in the study. The second graph shows straight line declining over time, these declines were seen in 13 species. The last graph shows a curvy line that increases sharply in the last two years, only one species (Melissodes bimaculata) increased in this way.
    Figure 3. Changes in abundance of three bee species between 2014 and 2016. These three species are representative of categories of species that were stable, declining, and increasing.

    Our collections were at 4 orchards all within a few miles of each other, so we don’t know if the patterns of declines we saw are happening in other areas. Also, 6 years of data are probably not enough to provide strong evidence of longer-term trends. Rather our patterns could be a product of year-to-year fluctuations that by random chance happened to show declines during our 6-year snapshot. Others have suggested at least 10 years of data are needed to detect long-term patterns of declines in insect populations. We are continuing our collections of hopes that we can provide more concrete evidence of population trends in the future.   

    In addition to studying changes in abundance over time (across years), we also looked at seasonal changes (within years). We wanted to understand how bee communities (the combination of species active at any given time) change from month to month. We found that bee communities in April, May, June, and July are all distinct. That means that each month you go out and look at bees between April and July you will see new species and unique combinations of species flying around. We also looked at seasonal patterns of abundance for our 40 focal species and that there were 3 types of life history strategies which are shown in Figure 4: 1) species are are active for just a short time in the spring such as mason bees and mining bees (pink), 2) those that are active for a short time just in the summer such as squash bees and long-horned bees (purple), and 3) species with a broad period of activity that are likely to be flying about from May all the way to September like bumble bees and most sweat bees (blue). Non-native honey bees had the widest period of activity, they are always around. 


    A grid with months April to October on the top and seven types of bees on the side. For each bee the squares are filled in for the month that most of the bees were captured. On the right are photos of each type of bee, high detailed photos of specimens with black backgrounds.
    Figure 4. Seasonal patterns of activity for seven types of bees in Pennsylvania. Filled in squares represent months in which the majority of bees were captured. See main text for further explanation of the patterns.

    Our analysis of bee monitoring data over 6 years helped us learn a great deal about the natural history of bee communities and species-level insight for 40 co-occurring species. Our results are concerning because they suggest there could be declines in species’ abundances and community-wide biodiversity in recent years, but further study is needed to know if this is part of an ongoing pattern. We hope that data like this will be helpful in identifying species of conservation concern, or species that could be good indicators for detecting threats to other bees or insects more generally. We also hope that basic natural history data on many species will be useful for guiding conservation and habitat restoration efforts focused on helping bees and other pollinators. You can read more about this research in our open access paper published in Ecology and Evolution: 

    Turley NE, Biddinger DJ, Joshi NK, López-Uribe MM. Six years of wild bee monitoring shows changes in biodiversity within and across years and declines in abundance. Ecology and Evolution.  
     

  • A diamond in the pumpkin patch

    A diamond in the pumpkin patch

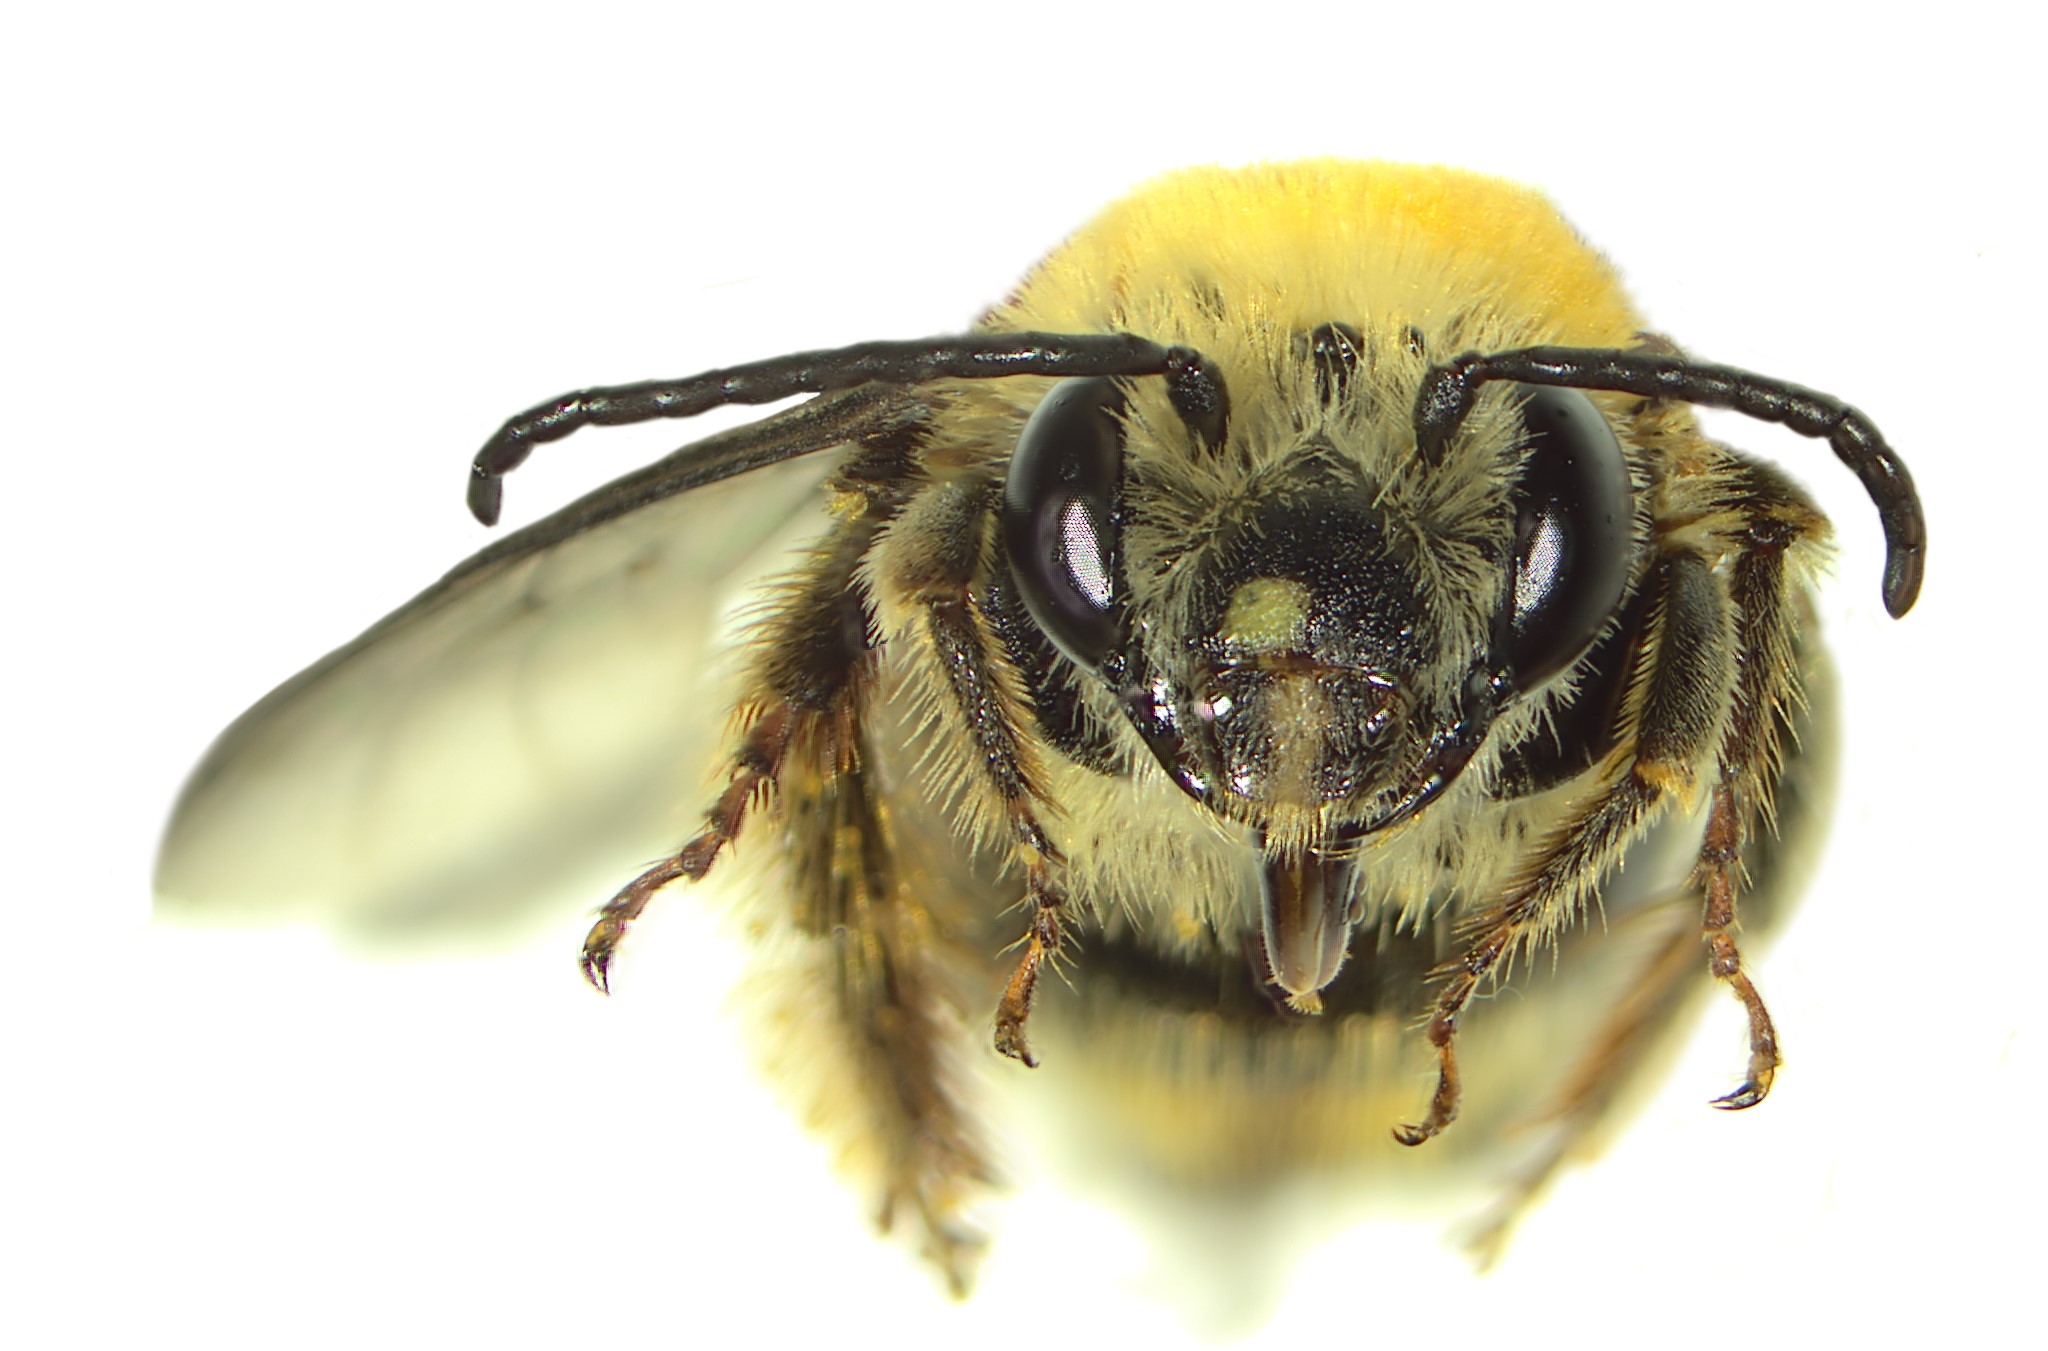
    I visit pumpkin farms across Pennsylvania to investigate host-pathogen dynamics in bee communities. In pumpkin fields, we typically see three bee species foraging – honey bees, wild bumble bees and wild squash bees. Haven’t heard of squash bees before? These are incredibly important, solitary bees that specialize on the pollen of pumpkin and squash. In fact, they are some of the best pollinators for pumpkin crops in Pennsylvania! Unlike social honey bees and bumble bees where only females bring food back to the hive, both male and female squash bees forage on flowers for nectar, and the females collect pollen for their offspring. Female and male squash bees also behave differently; the females spend much of their time collecting pollen to bring back to their nests, whereas the males frequent many flowers during the morning in search of females and occasionally nectar. Because of these sex-specific behaviors, identifying squash bees by sex is critical to understanding their independent roles in host-pathogen dynamics. However, last year I learned that this isn’t always as simple as it seems.


    Squash bees live by the motto, “the early bee gets the nectar,” often starting their day well before sunrise. In order to study them, we have to live by a similar motto, “the early researcher gets the bee.” On one particular day, my labmate Ginamaría Roman-Echevarría and I drove to Butler, PA, starting our journey as usual, at about 3:00AM. In fact, everything about the start to our day was as it usually was: we drank too much coffee, sang along to our field work playlist, and then collected bees in the all-too-cold morning weather. When collecting squash bees, we try to confirm their sex from a few key characters. The males have long antennae and a yellow spot on their face. The females have bushy hind legs covered in long setae that they use to transport pollen back to their nests. When in the flower, we identify these busy mothers the fastest since their legs look enlarged and bright yellow from the pollen they’ve collected. I remember finding one such female, though strangely, only one leg looked full of pollen. I noticed she was indeed collecting pollen, even if only successfully on one leg, so I scooped her up and labeled her as female. When we were satisfied with the day’s haul we drove back to the lab. The hard part was over, or so we thought.


    At the lab, I first confirm our field identifications before determining pathogen loads. When going through the bees to confirm their identifications this particular day, I noticed something strange. One female-labeled bee, the inefficient pollen-collector, had a long antennae. Then I noticed, she had a yellow spot on one side of her face. Lastly, I realized I had unfairly judged her pollen-packing abilities in the field – her left leg didn’t have the long setae it needed to hold pollen! What I was looking at, ladies and gentleman, was a half-lady, half-gentleman. Her head was split as left-female, right-male, yet her body was split right-female, left-male. We had found a mosaic gynandromorph, where male and female characters are patchily distributed throughout the body. These bees are very rare to find in the field and the mechanisms that lead to their development are not well known. In other organisms, gynanders can develop due to external stressors such as pollution, or even parasitism! We may never know what caused this particular bee to develop into a gynandromorph. However, we hope that with more documentation of these individuals in wild systems, we may be able to capture the frequency of their occurrence, and potentially identify what stressors may result in their development.


    To learn more about this particular specimen or the potential developmental and environmental mechanisms of gynandromorphism in insects, check out our article in the Journal of Melittology.


    Photo credit: Laura Jones and Shelby Kilpatrick

    Contributed post by

    Laura Jones, PhD Candidate

    Intercollege Graduate Degree Program in Ecology

    Pennsylvania State University

  • Pollinator Webinar Series – Summer 2020

    Pollinator Webinar Series – Summer 2020

    cover_small

    Wednesdays @3PM (EST) – 1h 15 min via zoom

    Join us for the Pollinator Webinar Series organized moderated by Tom Butzler and Dr. Margarita Lopez-Uribe from Penn State Extension. These eight webinars will cover a whole range of topics from beekeeping management to wild bee biodiversity and how to create habitat for pollinators. Webinars will take place on consecutive Wednesdays, starting on June 3rd at 3 PM (EST), 2 PM (CST), 1 PM (MST), and 12:00 PM (PST). Even though registration is required, there is no cost for attending these webinars. Find details about the webinar topics and how to register below.


    June 3rd – Pollinator Health Challenges: A bee’s perspective (Margarita López-Uribe) – Several bee populations are in decline around the globe. Like for many other animals and plants, the drivers of bee declines include habitat destruction, exposure to pesticides, increased pathogen burden, and climate change. This seminar will explain in detail how these stressors impact bee health throughout each step of the bee’s life cycle. [Watch Now] [Read Summary]


    June 10th – The three most important steps to ensuring honey bee colony survival over the long term (Robyn Underwood) – Honey bee colony management is essential for survival throughout the year. This seminar will give information about how to manage queen issues, how to monitor and treat for varroa mites, and how to prevent starvation in winter. [Watch Now] [Read Summary]


    June 17th – Queen rearing basics (Kate Anton) – Overview of working with queens as part of apiary management, queen biology, rearing (on any scale) to increase successful outcomes for beekeepers. [Watch Now] [Read Summary]


    June 24th – Bee nutritional ecology: from flowers to landscapes (Christina Grozinger) – We know bees need to collect nectar and pollen from flowers, but which flowers provide the best food for bees? Do all bees prefer the same flowering plant species? This seminar will describe studies at the Penn State Center for Pollinator Research aimed at answering these questions, and will provide steps you can take to learn about the floral resources in your gardens and surrounding landscapes, and find the plants that will help the community of bees in your backyard. [Watch Now] [Read Summary]


    July 1st – Mason bee management for backyard and orchard pollination (Natalie Boyle) – Mason beekeeping is a fun and easy way to harness the pollination power of solitary bees for agricultural producers and backyard gardeners alike. This seminar will introduce you to the mason bee life cycle, and provide instruction on where, when, and how to manage them sustainably and responsibly. [Watch now] [Read Summary]


    July 8th – Bumble bee biology and management for pollination (Erin Treanore) – Bumble bees are well-known for their fuzzy appearance and charismatic buzzing as they fly from flower to flower, but did you know these characteristics are part of the reason they’re such great pollinators? Gardeners, farmers, and bee-enthusiasts alike will benefit from learning more about the bumble bee life cycle and why they’re so important to our ecosystems. This seminar will also provide recommendations for landscape management to support these pollinators and discuss the commercial bumble bee industry. [Watch Now] [Read Summary]


    July 15th – Bee Biodiversity in Pennsylvania (Margarita López-Uribe) – Pennsylvania is home to over 430 species of bees but who are they? How are they different from each other? Are all species native to North America? How can you help conserve bees? You will find answers to all of these questions in this seminar. [Watch Now] [Read Summary]


    July 22nd – Gardening for pollinators (Connie Schmotzer) – Is your property pollinator-friendly? Learn how to maximize your garden’s potential for supporting a variety of pollinators, especially bees, which require specific nesting habitats and a broad range of flower shapes and types in order to thrive. Also learn some of the best plants to include in your pollinator-friendly yard, tips on planting, and how you can certify your Pennsylvania Pollinator-Friendly Garden. [Watch Now] [Read Summary]


    For more information, email Tom Butzler (tmb124.at.psu.edu) or Margarita López-Uribe (mml64.at.psu.edu)