Category: Blogs

  • Temperature, size, and pathogen load affect wild bee heat tolerance

    Temperature, size, and pathogen load affect wild bee heat tolerance

    Evaluating species’ thermal tolerance is important now more than ever given the ongoing threats to biodiversity under climate change. Species vary widely in heat tolerance, but the degree of variability in their heat tolerance, and the drivers of this variability among populations, are less understood. We expect that some of this variation in bees may be attributed to microclimate, physical differences among individuals, or differences in their infection status. Among “cold-blooded” animals (internal body temperatures are not regulated), larger organisms tend to be more thermally tolerant, and so size likely explains some heat tolerance variation. For individuals in the wild, other factors may impact thermal tolerance, such as infection.


    Bees are cold-blooded animals that pollinate the majority of plants in both natural and agricultural ecosystems. Several bee species are known to be in decline, and stressors such as climate variability and pathogen pressure, among others, are drivers of these declines. However, how these factors impact heat tolerance in bees has not been characterized for wild populations. In this study, we asked, (1) is variation in heat tolerance among populations explained by temperature?, (2) are there size differences among individuals that relate to differences in heat tolerance?, and finally, (3) does pathogen infection reduce heat tolerance?


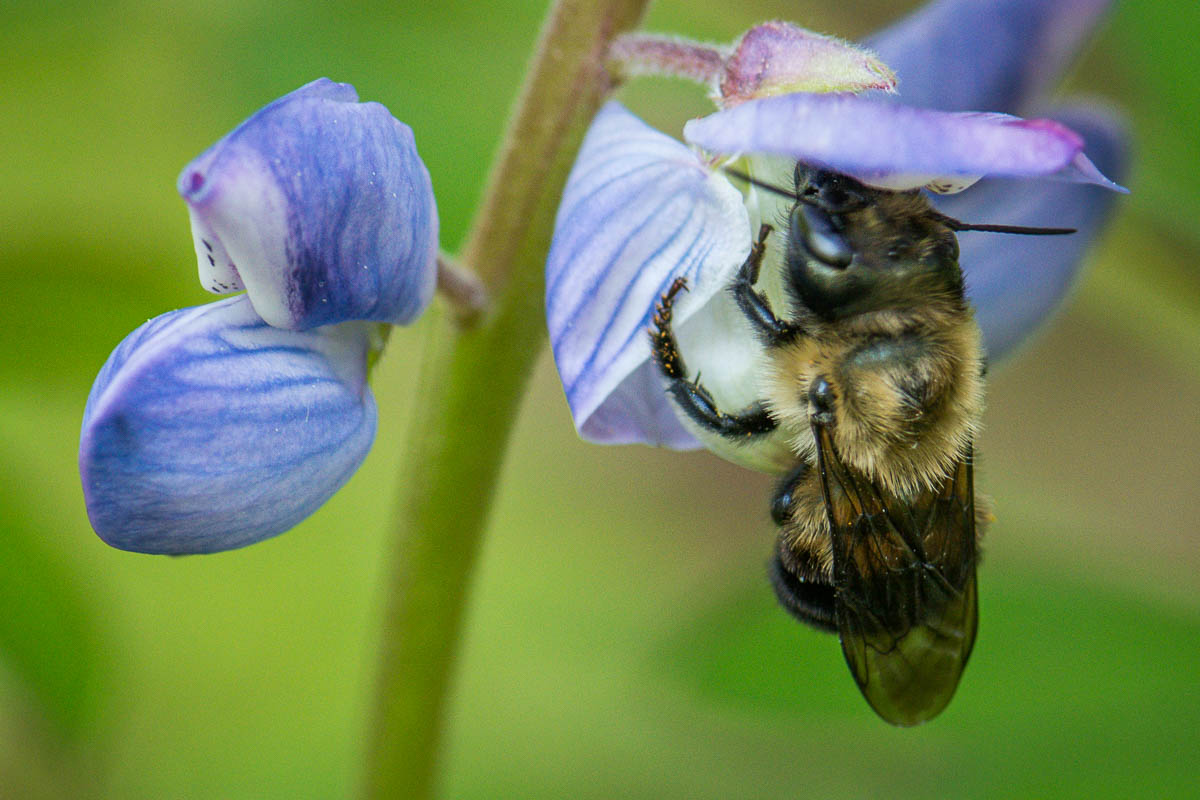
    We evaluated the heat tolerance of squash bee (Xenoglossa pruinosa) populations across a thermally variant gradient in Pennsylvania, USA. To determine a bee’s heat tolerance, we measured its critical thermal maximum (CTmax), which gives us a proxy for the highest temperature that individuals can withstand. We also weighed the bees and screened them for three common parasite groups – trypanosomes (e.g., Crithidia mellificae), Spiroplasma apis (mollicute bacteria), and Vairimorpha apis (microsporidian, formerly Nosema apis) – to see if body size or pathogen load impacted their heat tolerance.


    We found that temperature did not predict heat tolerance in our squash bee populations. However, we found a strong association between temperature and population-level variation in heat tolerance. Specifically, sites with higher daily temperatures excluded bees with low or high heat tolerance, suggesting that heat stress reduces variation in this trait. Regarding size, we found that larger squash bees were more heat tolerant in congruence with previous studies, but interestingly, males were twice as sensitive to this size effect compared to females! Male squash bees were 40% smaller than females, and so this finding suggests that smaller individuals may be more vulnerable to heat stress. Lastly, we only found that one parasite group, trypanosomes, reduced heat tolerance in highly infected individuals – and again, this effect was sex-dependent! It seems that female squash bees have a harder time tolerating heat when they are hosting a lot of trypanosome parasites in their guts, whereas male heat tolerance isn’t affected by the extra company.


    So, what do our findings mean for understanding variation in heat tolerance among bees and their response to heat stress in the future? First of all, this study provides preliminary evidence that extreme heat can reduce variation in heat tolerance within populations, even if it doesn’t reduce mean heat tolerance at those sites. This is relevant for understanding if populations will be able to buffer themselves against future climate regimes, as it suggests that heat stress is already excluding squash bees with low heat tolerance from sites and reducing heat tolerance for the others that are there. Our results also reveal an important gap in most studies of heat tolerance variation among insects and other taxa – sexes may vary in how size and infection status impact heat tolerance. In our system, we know that the sexes differ physically, behaviorally, and physiologically. For example, female squash bees dig nests underground to lay their eggs, spend their mornings collecting pollen for their young, and go to sleep in their nests by midday. In contrast, the smaller male squash bees do not need to collect pollen for their offspring, and instead look for mates in the morning and then go to sleep in wilted squash flowers. So, the squash bee sexes are expending energy differently (i.e., differences in parental care) and are exposed to different microclimates (i.e., females nest underground). Given the known differences in physical, behavioral, and physiological phenotypes among sexes for many species, the López-Uribe lab will continue to consider sex when evaluating bee thermal tolerance in current and future studies.


    For more details, check out the full article here:

    Jones, L. J., Miller, D. A., Schilder, R. J., López-Uribe, M. M. (2024). Body mass, temperature, and pathogen intensity differentially affect critical thermal maxima and their population-level variation in a solitary bee. Ecology and Evolution, 14(2), e10945


    Contributed post and photography by

    Laura J. Jones

    Postdoctoral Fellow of Plant-Pollinator Ecology

    Department of Integrative Biology at UT Austin


    This study was funded by the USDA-NIFA-AFRI Pollinator Health Program, Project 2022-67013-36274

    Questions? Contact Laura Jones via email at laura.jones@austin.utexas.edu or the López-Uribe lab at lopezuribelab@gmail.com
  • Habitat management is needed to conserve wild lupine populations and associated pollinators

    Habitat management is needed to conserve wild lupine populations and associated pollinators

    Wild lupine is a fire-adapted, perennial wildflower found throughout North America. Due to the loss of its primary habitat, wild lupine is currently of conservation concern in roughly 60% of its range. Lack of disturbance and land management that aims to preserve forests (not open habitats) are contributing factors to its habitat loss. In the midwest, large populations of wild lupine can still be found in oak savanna habitats. In contrast, its populations on the east coast are constrained to early successional edge habitats that are managed for infrastructure like roadsides and powerline rights-of-ways. These human-created habitats are not only refugia for wild lupine but also many other open-habitat associated species of conservation concern.

    Habitat comparisons between the natural (A) and human-made (B–C) habitats where Lupinus perennis grows. Habitat depictions include savanna habitat (A), roadside habitat (B), and powerline right-of-way habitat (C). Boxes are not to scale. Created with https://www.biorender.com

    Wild lupine habitat supports several specialist insect herbivores, and many floral visitors and pollinators. Three endangered butterfly species depend on wild lupine for reproduction, including the Karner blue butterfly (Lycaeides melissa samuelis), the Frosted elfin (Callophrys irus), and the Persis dusky wing (Erynais persius). These butterflies feed on wild lupine leaves as caterpillars and depend on this food source to survive. Other insects such as mason bees (Osmia spp.) and bumble bees (Bombus spp.) visit wild lupine for pollen and nectar resources and are the primary pollinators of wild lupine in Pennsylvania.

    To aid in the conservation efforts of wild lupine and associated insects, we summarize the existing literature about wild lupine biology and habitat management in our recent paper. Wild lupine prefers open or partially shaded habitat conditions, with a canopy cover of 50% or less, sandy, well-drained soils, and reduced woody vegetation. Previous research suggests that habitat restoration and management can achieve optimal wild lupine habitat with prescribed fire, canopy removal, and herbicide use. Additionally, fences can exclude herbivores like white-tailed deer that consume wild lupine. These management practices do not have substantial negative effects on associated pollinators. Specifically following prescribed fire, studies have shown neutral or positive effects on bee abundance and diversity. Management practices can also be aided through a better understanding of the patterns of genetic diversity in lupine populations (e.g., avoiding inbreeding depression and conserving locally adapted populations). We are currently investigating the effects of prescribed fire and herbivore exclusion fencing on wild lupine fitness and pollinator visitation throughout Pennsylvania. Furthermore, we are assessing the population genetics of wild lupine in varying habitats throughout its range in efforts to conserve wild lupine habitat.

    Wild lupine blooms following a prescribed burn applied in the previous dormant season. Photo: Isabella Petitta

    You can read more about this research in our paper published in Plant Ecology: 

    Petitta IR, López-Uribe MM, Sabo AE. Biology and management of wild lupine (Lupinus perennis L.): a case study for conserving rare plants in edge habitat. Plant Ecology.

  • Spotted Lanternflies and Beekeeping

    Spotted Lanternflies and Beekeeping

    by Robyn Underwood


    The Spotted Lanternfly (SLF), Lycorma delicatula, is an introduced plant hopper from China that is rapidly expanding its range in the United States. Since arriving in Berks County, Pennsylvania in 2014, lanternflies have spread to and become established in 13 states (CT, DE, IN, MA, MD, MI, NC, NJ, NY, OH, PA, RI, and VA). This invasive insect is a significant economic threat, as it feeds on and damages grapevines and stresses trees. In addition, lanternflies are a major nuisance to humans, especially in the late summer and early fall when the adults aggregate and are very noticeable. Adult lanternflies, found in abundance on the trunks of trees, such as maples and tree-of-heaven, excrete large quantities of sticky, sweet honeydew as they feed on plant sap August-October. The honeydew covers the trunk of the tree and vegetation nearby, attracts sugar-loving insects, including honey bees, and promotes the growth of black sooty mold.


    To reduce the spread of these insects, a few things are important to know for beekeepers. Lanternfly eggs can be laid on hive boxes, lids, bottom boards, stands, pallets, etc. In addition, adult lanternflies often jump into vehicles. Beekeepers should check equipment, vehicles, trailers, etc. for lanternflies and their egg masses prior to moving the equipment. Inspection of hive equipment and removal of any life stages of SLF prior to movement is critical to avoid spreading it to new areas.


    In addition, once lanternflies become established in an area, beekeepers begin to notice an unusual late season honey collecting in their hives. The honeydew is a sugary liquid that accumulates where there are aggregations of lanternfly adults. Honey bees readily collect this honeydew and process it as honey. The taste of the honey depends on several factors including the plant the lanternflies are feeding on and the abundance of honeydew versus floral nectar in the processed honey.


    Answers to beekeepers’ frequently asked questions


    1. Is honey made from spotted lanternfly honeydew safe for consumption?

    Yes, the honeydew honey is safe for consumption by both bees and humans. Preliminary results of laboratory testing show that the levels of pesticides from lanterfly treatment efforts found in honeydew honey are exceedingly small and well below any level of concern. In addition, beekeepers in areas where lanterflies have been established for several years see that honey bees overwinter very well on this type of stored food.


    2. How can I recognize spotted lanternfly honeydew honey?

    Honey made from spotted lanternfly honeydew has a distinct smokey odor. The color is dark brown, but not nearly as dark or black as buckwheat honey. The honeydew honey is not as sweet as other honeys and it has a lingering aftertaste.


    3. Can I sell lanternfly honeydew honey?

    Yes! This honey is marketable. Bakeries readily purchase this honey for use. In unofficial taste tests, half or more of the people that try this honey think it tastes great. Similar to the differing opinions about the flavor of other distinct honeys, such as buckwheat honey, opinions vary.  In addition, clever marketing can make this a popular novelty.


    4. I don’t like the taste of honeydew honey and I don’t want to sell it. What can I do?

    To avoid extracting this honey, remove the honey you collected in spring and summer by the end of July. Honeydew honey begins to be collected by bees as lanternflies emerge as adults, usually in August. Do not place supers on colonies for fall honey collection. Instead, allow the bees to provision their hives with honeydew honey as winter feed. By spring, the bees will have turned that honey into new bees.


    Questions or comments? Contact Robyn Underwood at rmu1@psu.edu or 484-268-5208


  • What Have We Learned From 6 Years of Monitoring Wild Bees?

    What Have We Learned From 6 Years of Monitoring Wild Bees?

    There are around 4,000 bee species in the US and over 400 in Pennsylvania (Figure 1). With so many species it’s very difficult to know what’s going on with each species and any collection of species that co-occur at any given location. There’s growing concern that bees are declining because of a variety of stressors such as habitat loss, pesticides, invasive species, and climate change. While there is good evidence that some bumble bee species in the US are declining, the status and trends for most other species are largely unknown due to a lack of data. This is why there’s an ongoing effort to establish a US nationwide bee monitoring program. In our recently published paper we looked at changes in populations of many bee species using data from 6 years of intensive bee monitoring.


    A grid of 12 bee photos sitting on flowers. The bees vary in size, shape, and color.
    Figure 1. A variety of bees found in Pennsylvania, photos by Nash Turley CC BY-NC-SA 4.0

    We’ve been working to understand how populations of bees in-and-around several apple orchards in Southern Pennsylvania are changing over time. To do this we’ve been monitoring bees for the last 6 years using Blue Vane Traps (Figure 2), a type of trap that attracts and captures a wide variety of bees. With these we’ve collected data on what bees are active every single week between April and October for 6 years in a row. So far we’ve collected 144 species! This is 33% of the species found in the whole state. As is the case in all collections of species in nature, most species were rare, for half of the species we collected 5 or fewer individuals. However, we did have 40 species with enough observations to be able to look at population trends over time.


    A photo of a blue vane trap hanging from a pole with green vegetation in the background. The trap is about 1 foot tall with bright blue top with vanes and a funnel leading into a yellow tub at the bottom
    Figure 2. Blue Vane Trap, a type of insect trap that attracts and captures a wide variety of bees and other pollinating insects. Photo by Nash Turley CC BY-NC-SA 4.0.

    We found that 26 species were stable over time, that is, no detectable change in abundance between 2014-2019 (Figure 3). However, 13 species, or about ⅓ of the species we could measure, declined in abundance over time. Many of the declining species were bumble bees and sweat bees. By contrast, only 1 species increased in abundance over time. In addition to changes in species’ abundances, we also saw declines in the number of species observed. At the peak year we found an average of 46 species at each collection site which dropped to an average of 30 species per site at the end of our study.


    Three graphs with bee abundance on the y axis and years on the x axis with points and trend lines. These show the abundance of bees between 2014 and 2019. The first graph there is no trend, no change over time, which is the pattern for 26 species in the study. The second graph shows straight line declining over time, these declines were seen in 13 species. The last graph shows a curvy line that increases sharply in the last two years, only one species (Melissodes bimaculata) increased in this way.
    Figure 3. Changes in abundance of three bee species between 2014 and 2016. These three species are representative of categories of species that were stable, declining, and increasing.

    Our collections were at 4 orchards all within a few miles of each other, so we don’t know if the patterns of declines we saw are happening in other areas. Also, 6 years of data are probably not enough to provide strong evidence of longer-term trends. Rather our patterns could be a product of year-to-year fluctuations that by random chance happened to show declines during our 6-year snapshot. Others have suggested at least 10 years of data are needed to detect long-term patterns of declines in insect populations. We are continuing our collections of hopes that we can provide more concrete evidence of population trends in the future.   

    In addition to studying changes in abundance over time (across years), we also looked at seasonal changes (within years). We wanted to understand how bee communities (the combination of species active at any given time) change from month to month. We found that bee communities in April, May, June, and July are all distinct. That means that each month you go out and look at bees between April and July you will see new species and unique combinations of species flying around. We also looked at seasonal patterns of abundance for our 40 focal species and that there were 3 types of life history strategies which are shown in Figure 4: 1) species are are active for just a short time in the spring such as mason bees and mining bees (pink), 2) those that are active for a short time just in the summer such as squash bees and long-horned bees (purple), and 3) species with a broad period of activity that are likely to be flying about from May all the way to September like bumble bees and most sweat bees (blue). Non-native honey bees had the widest period of activity, they are always around. 


    A grid with months April to October on the top and seven types of bees on the side. For each bee the squares are filled in for the month that most of the bees were captured. On the right are photos of each type of bee, high detailed photos of specimens with black backgrounds.
    Figure 4. Seasonal patterns of activity for seven types of bees in Pennsylvania. Filled in squares represent months in which the majority of bees were captured. See main text for further explanation of the patterns.

    Our analysis of bee monitoring data over 6 years helped us learn a great deal about the natural history of bee communities and species-level insight for 40 co-occurring species. Our results are concerning because they suggest there could be declines in species’ abundances and community-wide biodiversity in recent years, but further study is needed to know if this is part of an ongoing pattern. We hope that data like this will be helpful in identifying species of conservation concern, or species that could be good indicators for detecting threats to other bees or insects more generally. We also hope that basic natural history data on many species will be useful for guiding conservation and habitat restoration efforts focused on helping bees and other pollinators. You can read more about this research in our open access paper published in Ecology and Evolution: 

    Turley NE, Biddinger DJ, Joshi NK, López-Uribe MM. Six years of wild bee monitoring shows changes in biodiversity within and across years and declines in abundance. Ecology and Evolution.  


  • The Master Gardener Bee Monitoring Project

    The Master Gardener Bee Monitoring Project

    This post is contributed by Tony Shaw, a Master Gardener who is a member of the Pennsylvania Bee Monitoring Project.


    Early in Summer 2021, the Master Gardener Leadership Team invited Master Gardeners across the Commonwealth to participate in a new partnership with PSU professor Dr. Margarita López-Uribe. Her lab spearheads pollinator and bee research at Penn State University. 


    Quoting the MG Leadership Team’s invitation, partnering with the Master Gardener program “ . . . provides a unique opportunity to advance our knowledge of the status of wild bee populations in Pennsylvania . . . The proposed project capitalizes the interest of Master Gardeners in pollinators . . . while providing an educational opportunity for them [Master Gardeners].”


    I was fortunate to be selected as one of the first ten Master Gardeners scattered across the Commonwealth to participate in this pilot project. We began this Summer viewing several video presentations followed by a training workshop day at Shaver’s Creek Environmental Center near State College.


    We were trained there in bee trapping, collection methods and how to process the resulting bee specimens. We concluded with labeling and pinning the bees per entomological archiving standards. We will send the pinned collections to PSU’s bee taxonomists this Fall for identification, whereupon they will be stored in the Frost Museum.


    I am finding my participation to be an extremely enjoyable and rewarding experience. To date, I have completed five survey collection efforts; one of which was at our PSU Extension Office pollinator garden late this September.


    The accompanying photos shows two of the methods we used – the “blue-vane jar” and “cup” traps. The arrows on the blue vane photo point to two of the nine cups we place on the ground. Each method uses a mild dish soap solution to capture the bees.


    The nine cup photo shows that many other small invertebrates find their way into the traps. We leave these traps exposed for at least 24 hours. The last method we use is a simple bug net to chase down targeted hymenopterans like the stereotypical nerdy entomologist you see in Gary Larson’s Far Side cartoons.


    We record site location data, then return home to process the samples and pin the captured bees. Be assured that we are not indiscriminately amassing a bunch of dead insects. As you can see from the cup photo, a lot more than just bees get collected (“by- catch”).


    When we sort these blue-vane and cup samples, we retain and preserve all the non- hymenopteran insects and other invertebrates. The resulting by-catch samples will then be made available to other PSU research projects not focused on bees.


    During the first year of this pilot project, the field survey portion was launched at the beginning of August with August-September survey objectives. Since bee populations are seasonally variable, bees we would see in the spring are not necessarily the same taxonomic groups we will see in the Fall.


    Once we enthusiastically “got into it,” the Lab asked us to continue sampling into the Fall as we are able – as long as the weather holds out. In this way, we will be adding mountains of bee distribution data during a time of year that has historically been overlooked.


    The “buzz” is that, building on the successes of this pilot first year, the Lopez-Uribe Lab hopes to recruit additional Master Gardeners to train for next year’s survey efforts. I am looking forward to begin bee surveying next Spring.


    Contributed post by Tony Shaw

    Master Gardener