Category: Uncategorized

  • What Have We Learned From 6 Years of Monitoring Wild Bees?

    What Have We Learned From 6 Years of Monitoring Wild Bees?

    There are around 4,000 bee species in the US and over 400 in Pennsylvania (Figure 1). With so many species it’s very difficult to know what’s going on with each species and any collection of species that co-occur at any given location. There’s growing concern that bees are declining because of a variety of stressors such as habitat loss, pesticides, invasive species, and climate change. While there is good evidence that some bumble bee species in the US are declining, the status and trends for most other species are largely unknown due to a lack of data. This is why there’s an ongoing effort to establish a US nationwide bee monitoring program. In our recently published paper we looked at changes in populations of many bee species using data from 6 years of intensive bee monitoring.


    A grid of 12 bee photos sitting on flowers. The bees vary in size, shape, and color.
    Figure 1. A variety of bees found in Pennsylvania, photos by Nash Turley CC BY-NC-SA 4.0

    We’ve been working to understand how populations of bees in-and-around several apple orchards in Southern Pennsylvania are changing over time. To do this we’ve been monitoring bees for the last 6 years using Blue Vane Traps (Figure 2), a type of trap that attracts and captures a wide variety of bees. With these we’ve collected data on what bees are active every single week between April and October for 6 years in a row. So far we’ve collected 144 species! This is 33% of the species found in the whole state. As is the case in all collections of species in nature, most species were rare, for half of the species we collected 5 or fewer individuals. However, we did have 40 species with enough observations to be able to look at population trends over time.


    A photo of a blue vane trap hanging from a pole with green vegetation in the background. The trap is about 1 foot tall with bright blue top with vanes and a funnel leading into a yellow tub at the bottom
    Figure 2. Blue Vane Trap, a type of insect trap that attracts and captures a wide variety of bees and other pollinating insects. Photo by Nash Turley CC BY-NC-SA 4.0.

    We found that 26 species were stable over time, that is, no detectable change in abundance between 2014-2019 (Figure 3). However, 13 species, or about ⅓ of the species we could measure, declined in abundance over time. Many of the declining species were bumble bees and sweat bees. By contrast, only 1 species increased in abundance over time. In addition to changes in species’ abundances, we also saw declines in the number of species observed. At the peak year we found an average of 46 species at each collection site which dropped to an average of 30 species per site at the end of our study.


    Three graphs with bee abundance on the y axis and years on the x axis with points and trend lines. These show the abundance of bees between 2014 and 2019. The first graph there is no trend, no change over time, which is the pattern for 26 species in the study. The second graph shows straight line declining over time, these declines were seen in 13 species. The last graph shows a curvy line that increases sharply in the last two years, only one species (Melissodes bimaculata) increased in this way.
    Figure 3. Changes in abundance of three bee species between 2014 and 2016. These three species are representative of categories of species that were stable, declining, and increasing.

    Our collections were at 4 orchards all within a few miles of each other, so we don’t know if the patterns of declines we saw are happening in other areas. Also, 6 years of data are probably not enough to provide strong evidence of longer-term trends. Rather our patterns could be a product of year-to-year fluctuations that by random chance happened to show declines during our 6-year snapshot. Others have suggested at least 10 years of data are needed to detect long-term patterns of declines in insect populations. We are continuing our collections of hopes that we can provide more concrete evidence of population trends in the future.   

    In addition to studying changes in abundance over time (across years), we also looked at seasonal changes (within years). We wanted to understand how bee communities (the combination of species active at any given time) change from month to month. We found that bee communities in April, May, June, and July are all distinct. That means that each month you go out and look at bees between April and July you will see new species and unique combinations of species flying around. We also looked at seasonal patterns of abundance for our 40 focal species and that there were 3 types of life history strategies which are shown in Figure 4: 1) species are are active for just a short time in the spring such as mason bees and mining bees (pink), 2) those that are active for a short time just in the summer such as squash bees and long-horned bees (purple), and 3) species with a broad period of activity that are likely to be flying about from May all the way to September like bumble bees and most sweat bees (blue). Non-native honey bees had the widest period of activity, they are always around. 


    A grid with months April to October on the top and seven types of bees on the side. For each bee the squares are filled in for the month that most of the bees were captured. On the right are photos of each type of bee, high detailed photos of specimens with black backgrounds.
    Figure 4. Seasonal patterns of activity for seven types of bees in Pennsylvania. Filled in squares represent months in which the majority of bees were captured. See main text for further explanation of the patterns.

    Our analysis of bee monitoring data over 6 years helped us learn a great deal about the natural history of bee communities and species-level insight for 40 co-occurring species. Our results are concerning because they suggest there could be declines in species’ abundances and community-wide biodiversity in recent years, but further study is needed to know if this is part of an ongoing pattern. We hope that data like this will be helpful in identifying species of conservation concern, or species that could be good indicators for detecting threats to other bees or insects more generally. We also hope that basic natural history data on many species will be useful for guiding conservation and habitat restoration efforts focused on helping bees and other pollinators. You can read more about this research in our open access paper published in Ecology and Evolution: 

    Turley NE, Biddinger DJ, Joshi NK, López-Uribe MM. Six years of wild bee monitoring shows changes in biodiversity within and across years and declines in abundance. Ecology and Evolution.  


  • The Master Gardener Bee Monitoring Project

    The Master Gardener Bee Monitoring Project

    This post is contributed by Tony Shaw, a Master Gardener who is a member of the Pennsylvania Bee Monitoring Project.


    Early in Summer 2021, the Master Gardener Leadership Team invited Master Gardeners across the Commonwealth to participate in a new partnership with PSU professor Dr. Margarita López-Uribe. Her lab spearheads pollinator and bee research at Penn State University. 


    Quoting the MG Leadership Team’s invitation, partnering with the Master Gardener program “ . . . provides a unique opportunity to advance our knowledge of the status of wild bee populations in Pennsylvania . . . The proposed project capitalizes the interest of Master Gardeners in pollinators . . . while providing an educational opportunity for them [Master Gardeners].”


    I was fortunate to be selected as one of the first ten Master Gardeners scattered across the Commonwealth to participate in this pilot project. We began this Summer viewing several video presentations followed by a training workshop day at Shaver’s Creek Environmental Center near State College.


    We were trained there in bee trapping, collection methods and how to process the resulting bee specimens. We concluded with labeling and pinning the bees per entomological archiving standards. We will send the pinned collections to PSU’s bee taxonomists this Fall for identification, whereupon they will be stored in the Frost Museum.


    I am finding my participation to be an extremely enjoyable and rewarding experience. To date, I have completed five survey collection efforts; one of which was at our PSU Extension Office pollinator garden late this September.


    The accompanying photos shows two of the methods we used – the “blue-vane jar” and “cup” traps. The arrows on the blue vane photo point to two of the nine cups we place on the ground. Each method uses a mild dish soap solution to capture the bees.


    The nine cup photo shows that many other small invertebrates find their way into the traps. We leave these traps exposed for at least 24 hours. The last method we use is a simple bug net to chase down targeted hymenopterans like the stereotypical nerdy entomologist you see in Gary Larson’s Far Side cartoons.


    We record site location data, then return home to process the samples and pin the captured bees. Be assured that we are not indiscriminately amassing a bunch of dead insects. As you can see from the cup photo, a lot more than just bees get collected (“by- catch”).


    When we sort these blue-vane and cup samples, we retain and preserve all the non- hymenopteran insects and other invertebrates. The resulting by-catch samples will then be made available to other PSU research projects not focused on bees.


    During the first year of this pilot project, the field survey portion was launched at the beginning of August with August-September survey objectives. Since bee populations are seasonally variable, bees we would see in the spring are not necessarily the same taxonomic groups we will see in the Fall.


    Once we enthusiastically “got into it,” the Lab asked us to continue sampling into the Fall as we are able – as long as the weather holds out. In this way, we will be adding mountains of bee distribution data during a time of year that has historically been overlooked.


    The “buzz” is that, building on the successes of this pilot first year, the Lopez-Uribe Lab hopes to recruit additional Master Gardeners to train for next year’s survey efforts. I am looking forward to begin bee surveying next Spring.


    Contributed post by Tony Shaw

    Master Gardener


  • Oxalic acid applications to honey bee packages: Do they help reduce mites and viruses?

    Oxalic acid applications to honey bee packages: Do they help reduce mites and viruses?

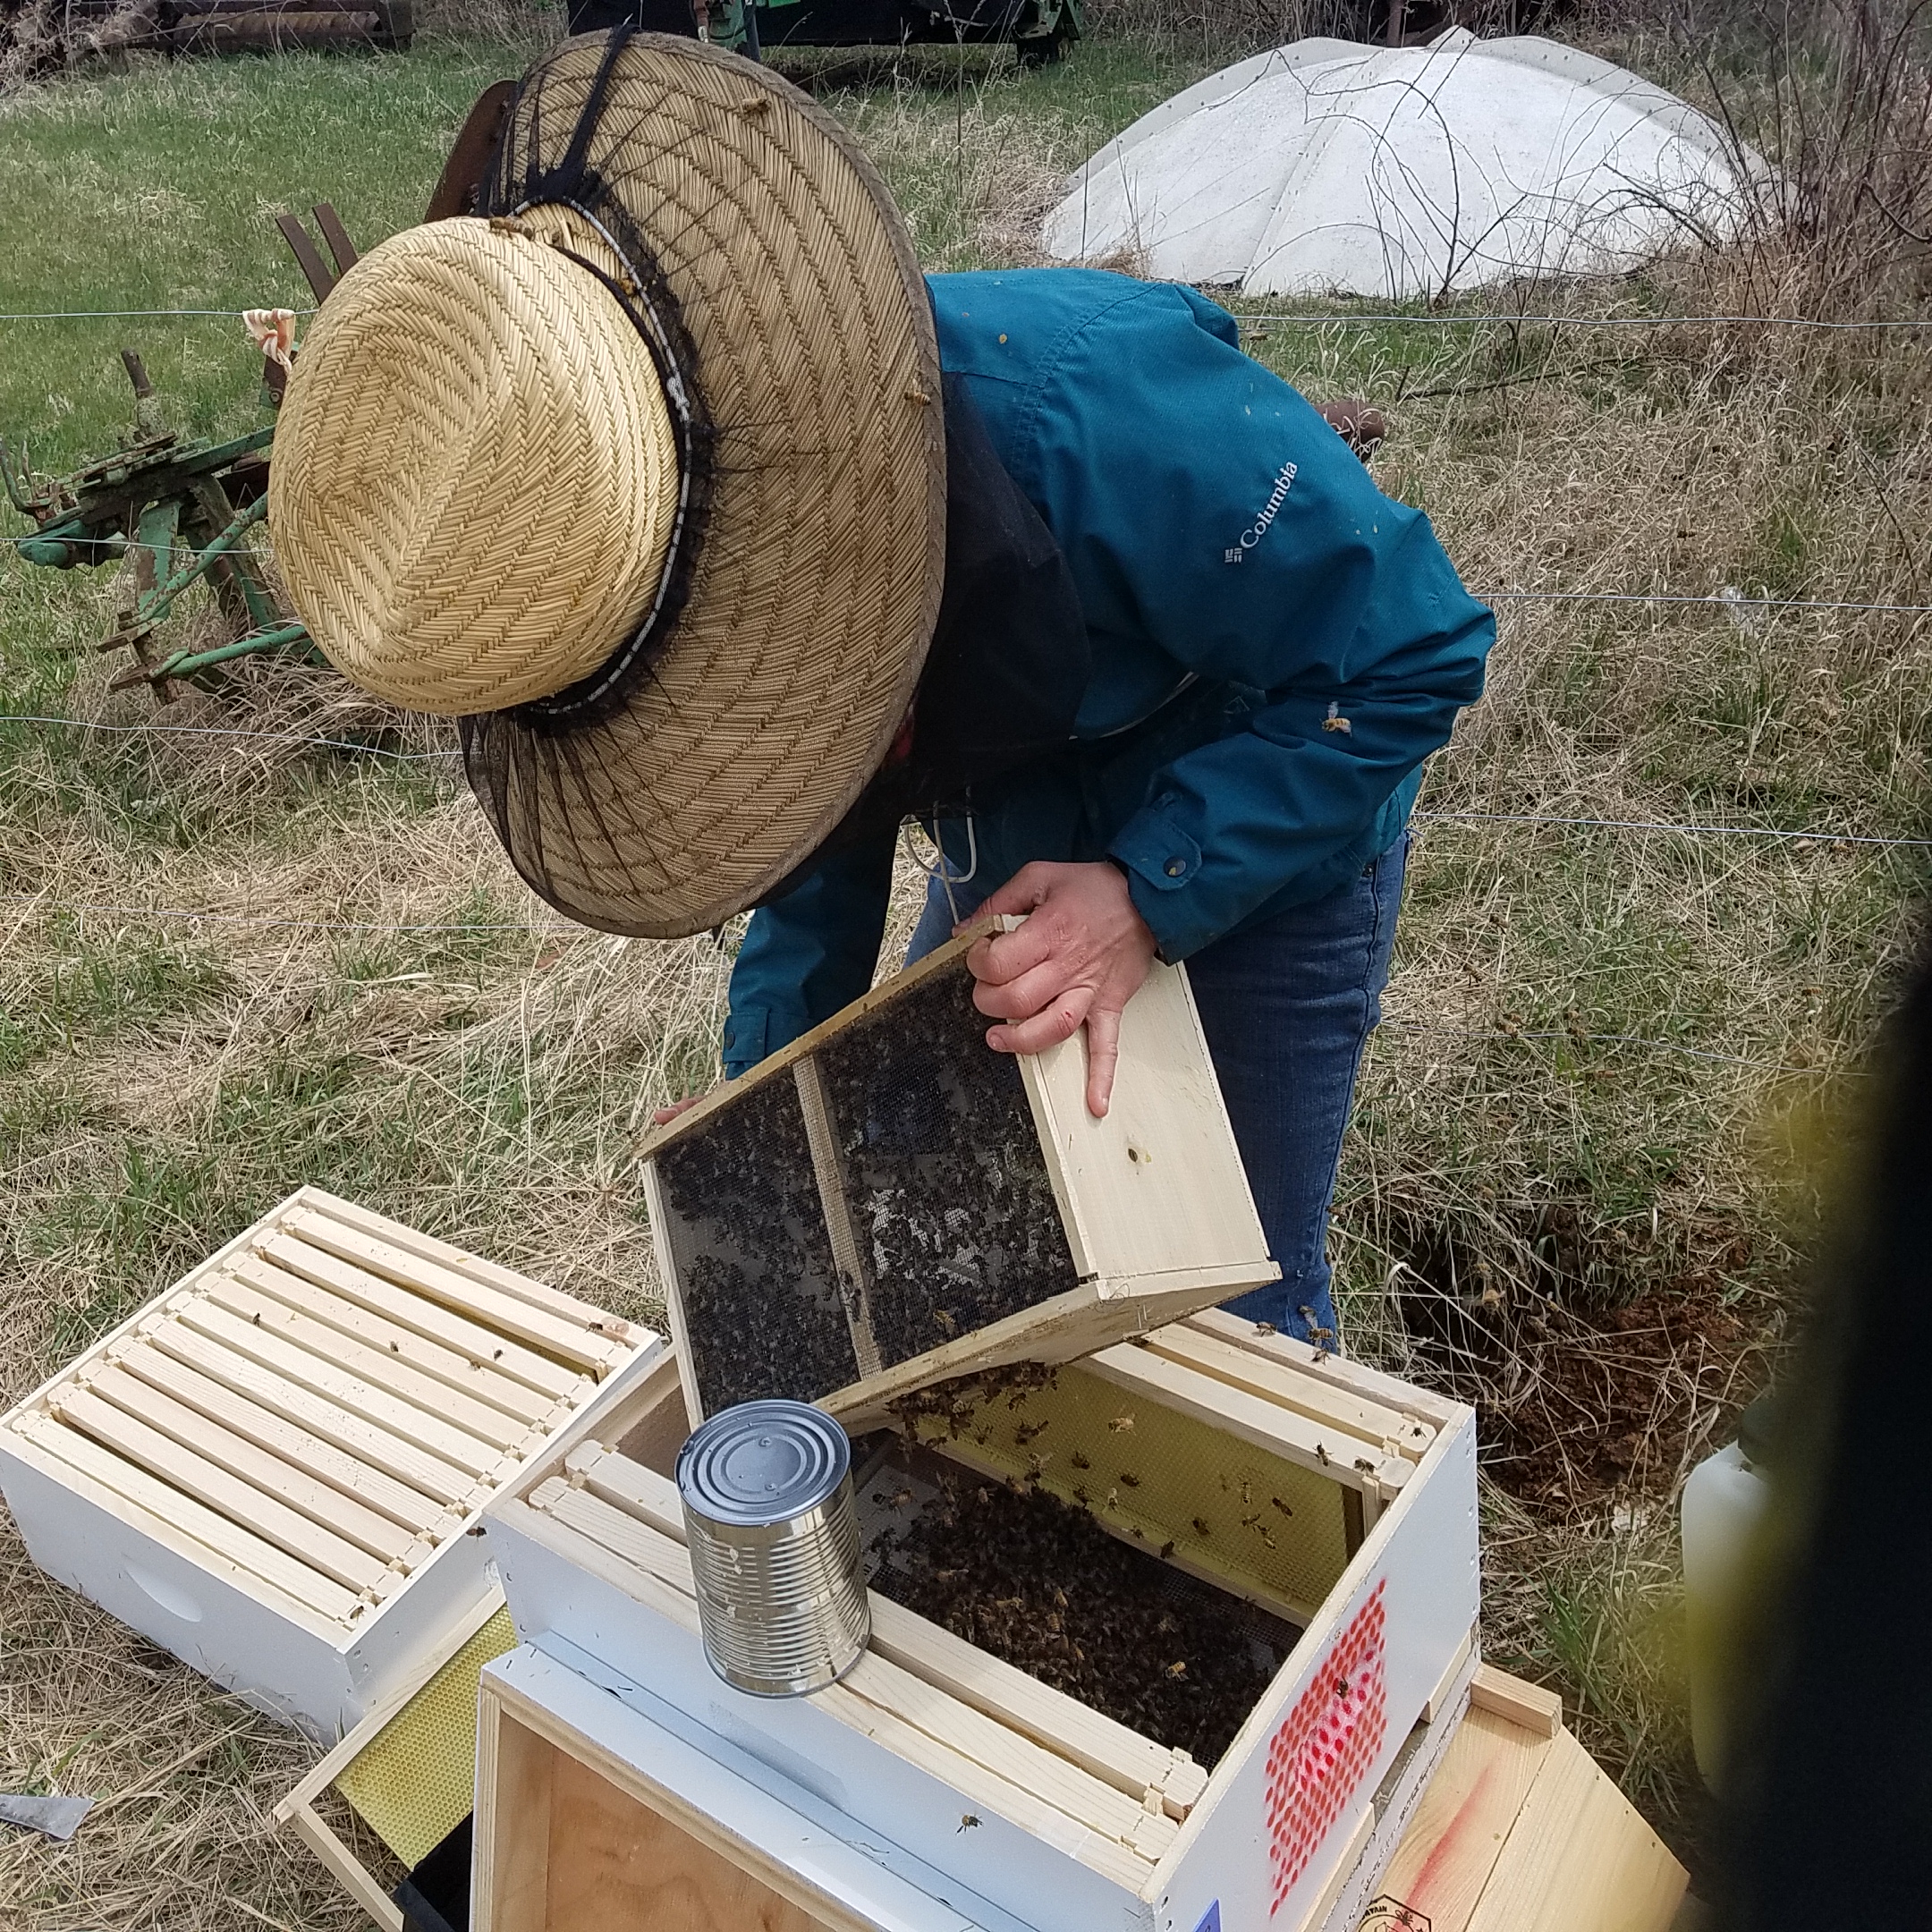
    Varroa mites are, without a doubt, one of the most difficult challenges for beekeeping management. Treating for mites is tricky: if you don’t treat for mites the probability of colony survival decreases by ≥55%, but if you overtreat mites may evolve resistance to treatments or there can be negative side effects for the bees. Thus, our general recommendation for beekeepers is to treat mites only when colonies are above threshold while using the least toxic, but effective, miticide treatments. Organic acids (formic and oxalic acid) are among the best and safest tools that beekeepers have available to control mites. In particular, oxalic acid is one of the most commonly used miticide treatments before installing packages in the spring (see detailed protocols here). Packages often come with a high number of mites, so many beekeepers choose to treat packages with oxalic acid. The question is: does it really make a difference for colony health to treat colonies with miticides in early spring? 

    To answer this question, we investigated the effects of using oxalic acid vapor treatments within one week of package installation in the spring in combination with natural swarming on the health of colonies. For the experiment, we established  27 3-lb packages in standard 10-frame Langstroth hives with screen bottom boards on April 7, 2017. Colonies were randomly assigned to one of two groups: treated with oxalic acid at a rate of 1 g per colony, one week after installation, or controls (untreated). 

    Figure 1. Oxalic acid application to honey bee packages (A) Honey bee package installation. (B) Oxalic acid treatment using the vaporization method. (C) Sticky boards used to quantify mite drops.

    During this experiment, efforts were not taken to prevent swarming. Natural swarming is another effective and safe approach to control mite populations, as the parent colony has a month-long break in brood production, which also causes a break in mite production. In addition, approximately 25% of the varroa mites leave with the issuing swarm. Colonies that swarmed were allowed to requeen themselves, resulting in a 3-week brood break for half of the colonies in the experiment. Mite levels were monitored throughout the duration of the study and bees were collected in May, July and September to quantify viruses.

    Our results indicate that treating packages using oxalic acid vapor provides a short-term reduction of Varroa mites in newly installed colonies, but found that, unless colonies swarm in the summer, there are no long-term benefits of the spring treatment in terms of mite levels and viruses (Figure 1). Thus, mite levels should be monitored and, if necessary, controlled throughout the season. Colony swarming did result in reduced mite and DWV levels in the fall. However, the break in the brood cycle resulted in a significant reduction in colony honey yield.

    Figure 2. Number of varroa mites drops in colonies in the control group and colonies that were treated with OA in the spring. OA only make a difference for varroa mite levels in colonies that swarmed in the summer

    We recommend implementing a brood break mid-season, either through swarming or the managerial equivalent (i.e., colony division), as a key tool for mite control for backyard beekeepers who do not rely on honey production as a main source of income. Colony division strategies could be easily integrated into a seasonal Integrated Pest Management (see this article: IPM) program and have the potential to serve as a non-chemical and cultural alternative to chemical miticides.

    This is a summary of Evans, K. C., Underwood, R. M., & López-Uribe, M. M. (2021). Combined effects of oxalic acid sublimation and brood breaks on Varroa mite (Varroa destructor) and deformed wing virus levels in newly established honey bee (Apis mellifera) colonies. Journal of Apicultural Research doi.org/10.1080/00218839.2021.1985260.


    Contributed post by

    Robyn Underwood, PhD, Assistant Research Professor of Entomology

    Margarita López-Uribe, PhD, Assistant Professor of Entomology

    The Pennsylvania State University

  • Honey bee viruses are common, but at low levels, in wild bees

    Honey bee viruses are common, but at low levels, in wild bees

    Pathogen transmission from honey bees to wild bees has been attributed as one of the major negative impacts that managed honey bees have on wild bee populations. Among the many pests and pathogens that attack honey bees, the varroa mite and its associated virus, deformed wing virus (DWV), are most abundant and detrimental to honey bee health. The synergistic interactions between this virus and varroa mites have increased the amount of DWV in honey bees and caused what is known as the DWV epidemic. 


    Because flowers are hubs of pathogen transmission among pollinators, the increased viral load of DWV in honey bees has likely facilitated its transmission to other bees and insects that share floral resources with honey bees. Indeed, several studies have reported the presence of DWV in various groups of insects including bumble bees, several groups of solitary bees, syrphid flies, ants, and cockroaches among others. However, studies investigating the transmission of DWV to other insects have focused on the detection (presence or absence) of the virus among pollinators, rather than the level of infection. While DWV infection has been demonstrated in bumble bees, infection in other bees and pollinators has not been shown. Thus, the question remains: are honey bee viruses abundant in wild bee populations? And if so, is the level of infection of honey bee viruses in wild bees related to how many honey bees are present?


    We investigated these questions through surveys of pollinator abundance and honey bee viruses—including DWV—in bee pollinators of pumpkin farms. For two years, we visited 18 pumpkin farms and collected honey bees, bumble bees, and squash bees to quantify the amount of DWV along with four other common honey bee viruses in these bees: 

    We found that DWV was the most common virus among the species sampled, with about 70% of the samples positive for DWV. Specifically, we found that 95% of the honey bees sampled had DWV, compared to 88% of bumble bees and 48% of squash bees. This corroborates with results from previous studies. However, when we quantified the relative levels of DWV in the three species, we found something unexpected! We found an average of 10 million copies of DWV in honey bees, compared to 48 viral copies in bumble bees and 4 viral copies in squash bees. Our results suggest DWV is widespread among these wild pollinators, but the virus does not present at the same level in wild bees as it does in honey bees. Due to the low number of DWV copies we detected in squash bees, we suspect that they are not good hosts for DWV, and that the virus is not infecting them. 

    So, what does this mean and how is this important to our understanding of interactions between honey bees and wild bees? First of all, this study provides empirical evidence that honey bee viruses are likely not having a large negative effect on wild bees. Indeed, experimental studies looking at the fitness costs of DWV infections in other bees have shown that DWV infects bumble bees but not solitary bees. Our results also seem to indicate that solitary bees are likely not severely impacted by the DWV epidemic that is attacking honey bees. This is particularly important given that wild bees often interact with feral honey bee colonies which have uncontrolled levels of varroa mites and experience extremely high DWV infection levels. While we found that wild bees may not be negatively impacted by these honey bee viruses, many wild bees are known to suffer from other pathogens and parasites. Our lab will continue to monitor pathogen and parasite burden in wild bee populations and look for farm management practices that may reduce these threats.


    To learn more about this study, check out our article:

    Jones, L.J., Ford, R.P., Schilder, R.J., López-Uribe, M.M., 2021. Honey bee viruses are highly prevalent but at low intensities in wild pollinators of cucurbit agroecosystems. Journal of Invertebrate Pathology. 185, 107667. 


    Contributed post by

    Margarita López-Uribe, PhD, Assistant Professor of Entomology

    Laura Jones, PhD Candidate in Ecology

    Pennsylvania State University

    Photo credit: Laura Jones
  • A diamond in the pumpkin patch

    A diamond in the pumpkin patch

    I visit pumpkin farms across Pennsylvania to investigate host-pathogen dynamics in bee communities. In pumpkin fields, we typically see three bee species foraging – honey bees, wild bumble bees and wild squash bees. Haven’t heard of squash bees before? These are incredibly important, solitary bees that specialize on the pollen of pumpkin and squash. In fact, they are some of the best pollinators for pumpkin crops in Pennsylvania! Unlike social honey bees and bumble bees where only females bring food back to the hive, both male and female squash bees forage on flowers for nectar, and the females collect pollen for their offspring. Female and male squash bees also behave differently; the females spend much of their time collecting pollen to bring back to their nests, whereas the males frequent many flowers during the morning in search of females and occasionally nectar. Because of these sex-specific behaviors, identifying squash bees by sex is critical to understanding their independent roles in host-pathogen dynamics. However, last year I learned that this isn’t always as simple as it seems.


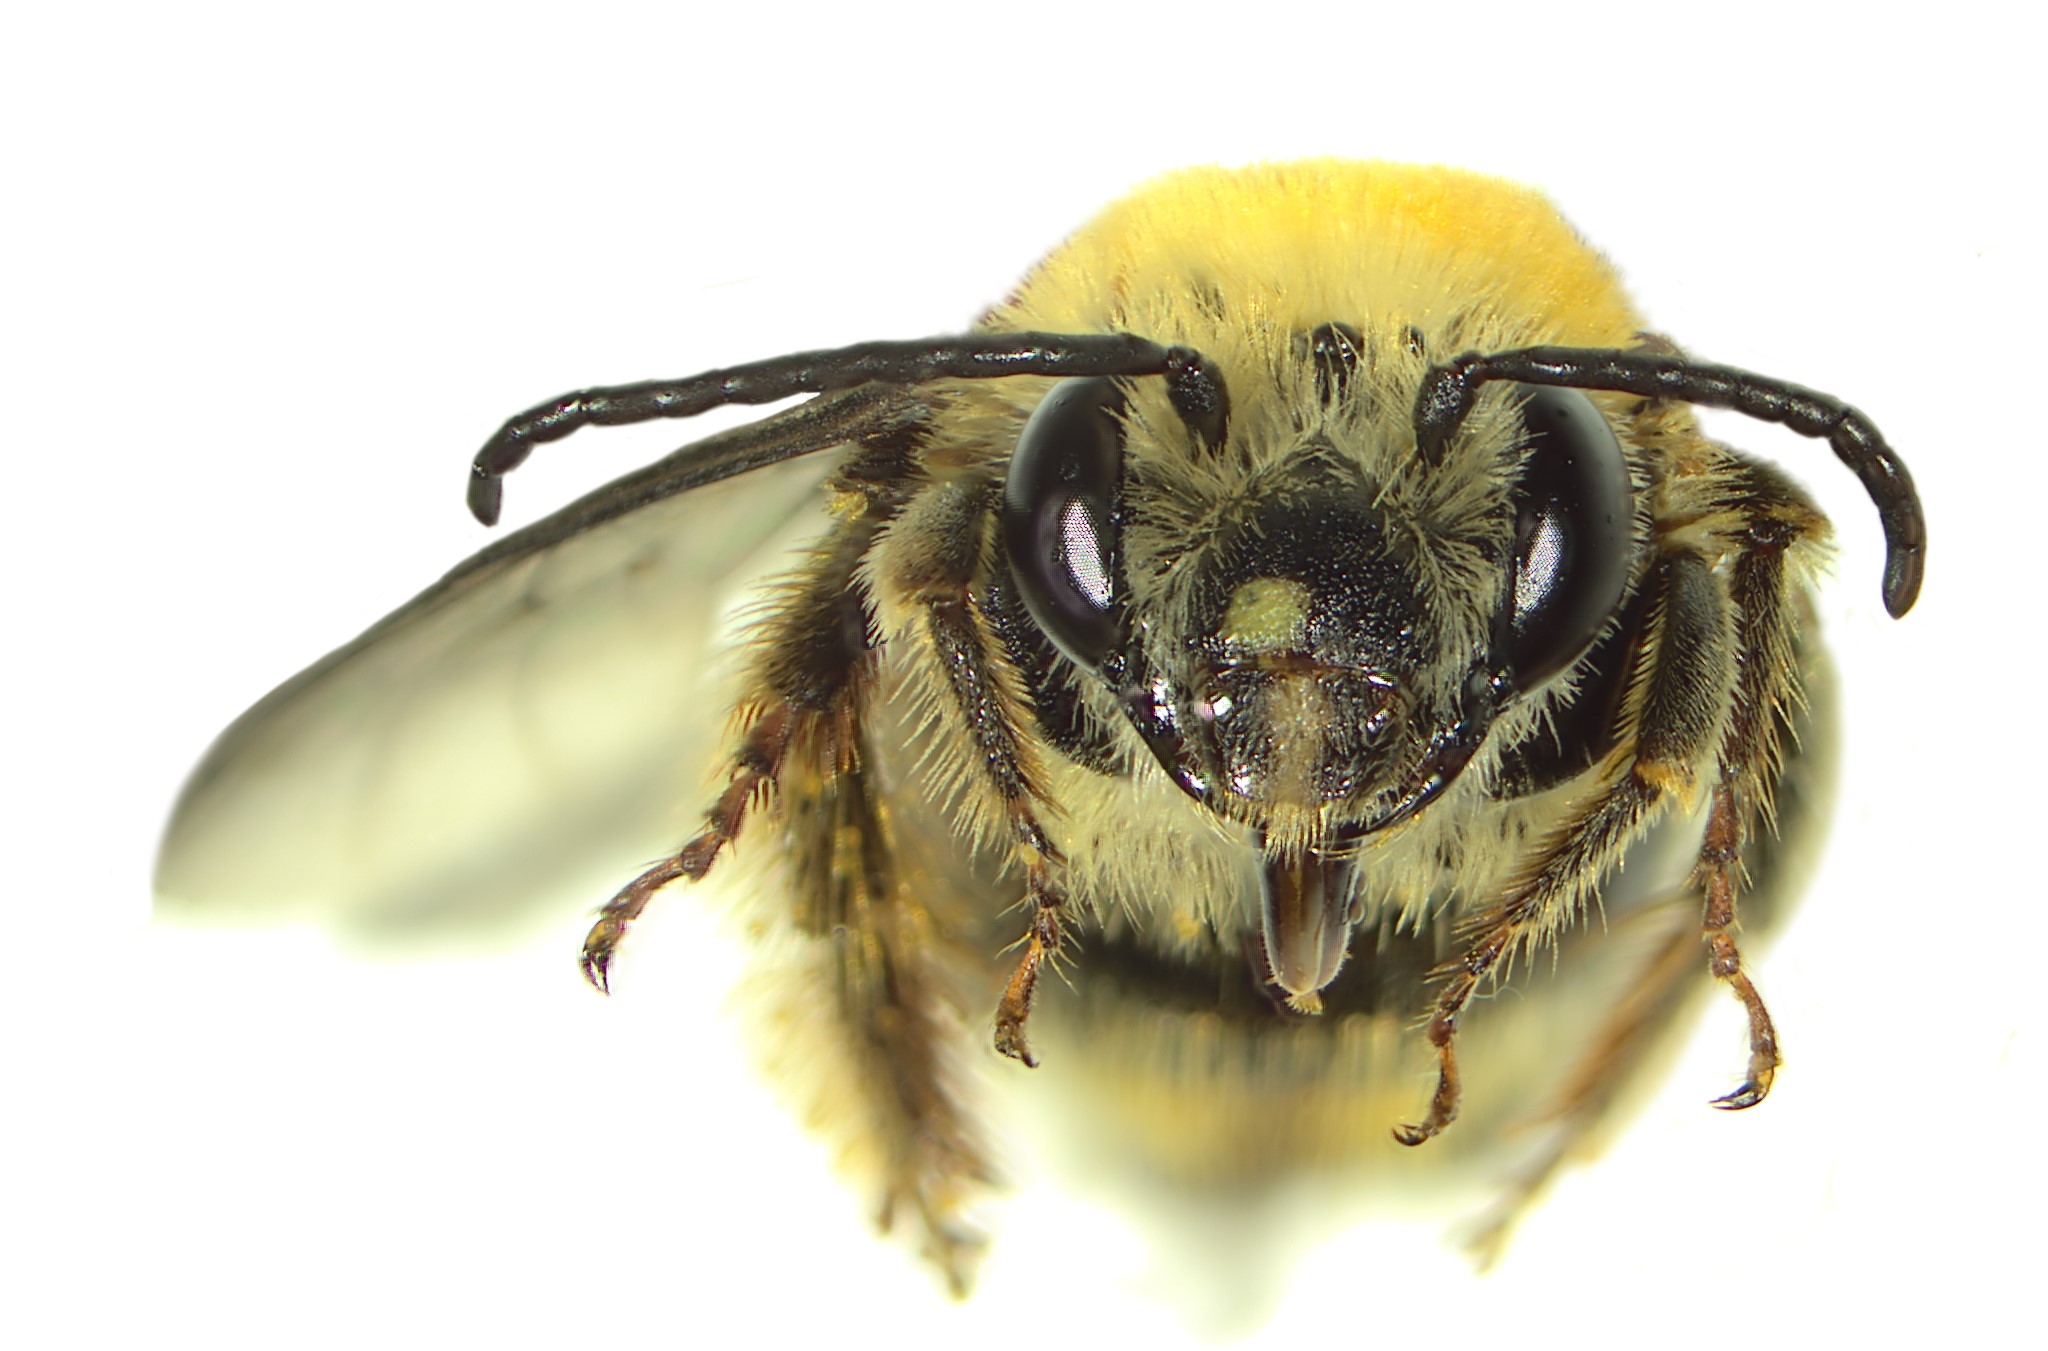
    Squash bees live by the motto, “the early bee gets the nectar,” often starting their day well before sunrise. In order to study them, we have to live by a similar motto, “the early researcher gets the bee.” On one particular day, my labmate Ginamaría Roman-Echevarría and I drove to Butler, PA, starting our journey as usual, at about 3:00AM. In fact, everything about the start to our day was as it usually was: we drank too much coffee, sang along to our field work playlist, and then collected bees in the all-too-cold morning weather. When collecting squash bees, we try to confirm their sex from a few key characters. The males have long antennae and a yellow spot on their face. The females have bushy hind legs covered in long setae that they use to transport pollen back to their nests. When in the flower, we identify these busy mothers the fastest since their legs look enlarged and bright yellow from the pollen they’ve collected. I remember finding one such female, though strangely, only one leg looked full of pollen. I noticed she was indeed collecting pollen, even if only successfully on one leg, so I scooped her up and labeled her as female. When we were satisfied with the day’s haul we drove back to the lab. The hard part was over, or so we thought.


    At the lab, I first confirm our field identifications before determining pathogen loads. When going through the bees to confirm their identifications this particular day, I noticed something strange. One female-labeled bee, the inefficient pollen-collector, had a long antennae. Then I noticed, she had a yellow spot on one side of her face. Lastly, I realized I had unfairly judged her pollen-packing abilities in the field – her left leg didn’t have the long setae it needed to hold pollen! What I was looking at, ladies and gentleman, was a half-lady, half-gentleman. Her head was split as left-female, right-male, yet her body was split right-female, left-male. We had found a mosaic gynandromorph, where male and female characters are patchily distributed throughout the body. These bees are very rare to find in the field and the mechanisms that lead to their development are not well known. In other organisms, gynanders can develop due to external stressors such as pollution, or even parasitism! We may never know what caused this particular bee to develop into a gynandromorph. However, we hope that with more documentation of these individuals in wild systems, we may be able to capture the frequency of their occurrence, and potentially identify what stressors may result in their development.


    To learn more about this particular specimen or the potential developmental and environmental mechanisms of gynandromorphism in insects, check out our article in the Journal of Melittology.


    Photo credit: Laura Jones and Shelby Kilpatrick

    Contributed post by

    Laura Jones, PhD Candidate

    Intercollege Graduate Degree Program in Ecology

    Pennsylvania State University